17. H-E-L-P!
17.1 Overwiew
I recently got an ad on my phone trying to sell me a service to become a data scientist in a month. This may make you think that doing data science with R is an easy, straight-forward process.
It is not.

Any time I have been struggling to learn a new tool/technology/software … I go back to this short clip I cut out of @hadleywickham’s 2014 @user2014_ucla tutorial on Dplyr to motivate myself to keep pushing through … learning new tools is hard for everyone at the beginning!- Brain AMA
— Aliakbar Akbaritabar (Ali) (@Akbaritabar) July 25, 2018
You will stumble, get frustrated, lost, and confused, make (silly) mistakes even when you think you know stuff, not understand how to perform a task, not understand why your code is generating an error, etc. It still happens to me all the time, and I am still googling really basic stuff about R, even after quite a few years using it. But as Alfred so helpfully points out to Bruce Wayne in Batman Begins, do not fall to pieces when you fail. Instead, learn to pick yourself up, learn from experience, practice more, and get better.
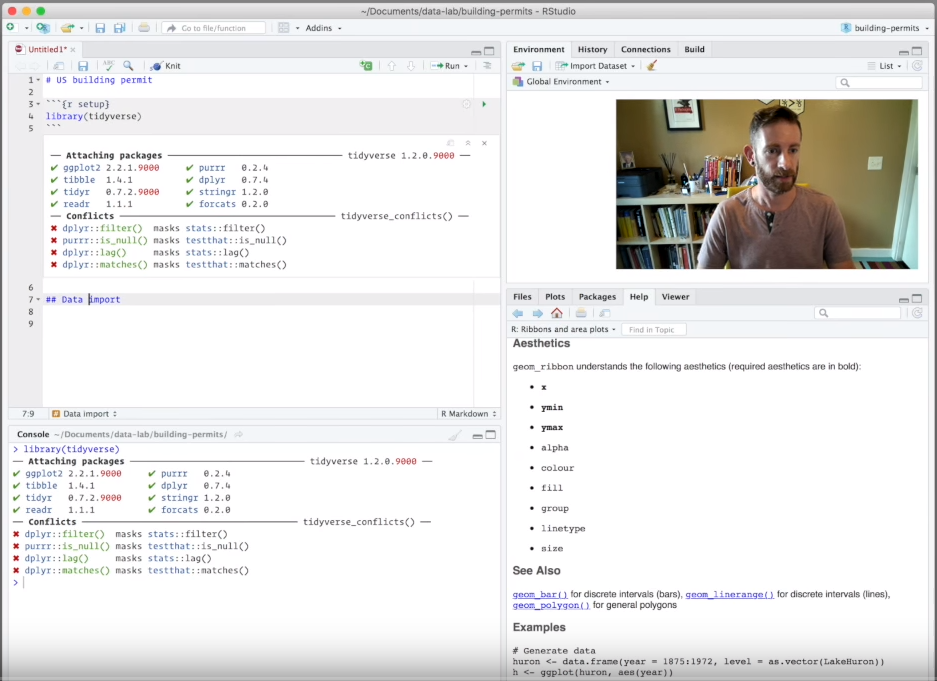
Back in 2018, Hadley Wickham, one the major driving forces behind the tidyverse, recorded a video of his live analysis of a dataset with the goal of demonstrating his approach.

It’s great to see Hadley, a true expert, undertake data analysis; he makes quite a few mistakes in this video and he even forgets the arguments for routines/packages he has written! But it’s even more powerful that he shrugs off the mistake, corrects it, and moves forward.
17.2 Error messages in R
Error messages are a normal part of working in R, not a sign you are bad. To make matters worse, R will alert you with red letters not just for errors, but for warnings, too. It helps to learn relatively early on how to decipher these messages and what common ones mean.
First, if after typing a command you see red letters, don’t panic– it may just be a warning, and most of the times you can ignore them or worry about them later.
But you will get errors (in red letters too!) As an example let me try to read a CSV file using the read_csv function

There are three main parts to an error:
- The declaration that it is an Error, and not a Warning
- The location of the error: it is in the
read_csv("myfile.csv")line of my code - The issue my code caused:
could not find function "read_csv", as I asked R to use a function from thereadrpackage but forgot to load it.
Let me try again.

The error given now is again produced by the same read_csv function, but the error is that the CSV file does not exist in the working directory.
17.3 Failure, and the 15 minute rule
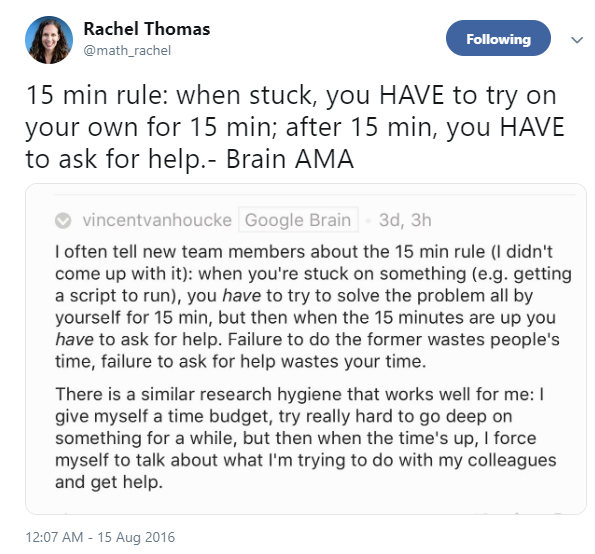
It’s good practice to follow the 15 minute rule. If you encounter a problem in your work, spend 15 minutes troubleshooting the problem on your own; Google, RStudio Support, and StackOverflow are good places to look for answers. SoIf you google your error message, you will find that 99% of the time someone has had the same error message and the solution is on stackoverflow.
However, if after 15 minutes you still cannot solve the problem, ask for help.

15 min rule: when stuck, you HAVE to try on your own for 15 min; after 15 min, you HAVE to ask for help.- Brain AMA
— Rachel Thomas (@math_rachel) August 14, 2016
17.4 The reprex package
How should you ask for help? You must provide enough information so others can understand what is the issue with your code and try to reproduce the issue on their own computer.Stackoverflow provides advice not only on technical questions but also on how to ask good questions! A very popular post addresses how to make a great R reproducible example:
The reprex package, written by Jenny Bryan, was developed to help create reproducible examples, so others can reproduce your code, run it, and see where the issue is.
17.4.1 reprex with copy-paste
Reprex works with whatever is currently saved on your clipboard. The easiest way to use reprex is to highlight with your mouse the part of code that gives you an error and copy it to your clipboard using Command+c (Mac) or Control+c(Windows)).
Now that the code has been higlighted, you can easily just type reprex() and the reprex code will now be on the clipboard, which means you can paste it directly into a new Rmd file
17.4.2 reprex directly with the reprex() command
Besides copy-and-paste which is the easiest way to use reprex, you can include the code you want to share ore debug directly into the reprex() command. Let us look at a few examples.
reprex(gapminder %>% summarise(lifeExp))
#> Error in gapminder %>% summarise(lifeExp): could not find function "%>%"
Created on 2019-07-16 by the reprex package (v0.3.0)

The error message given is that it cannot find the pipe operator %>%, as we haven’t given the library(dplyr) command. reprex will ensure that all the necessary data and packages are loaded. The information above is now automatically stored on your clipboard, and you can paste it directly (with Ctrl/Cmd+c) as needed.
Let us load the library and try again.
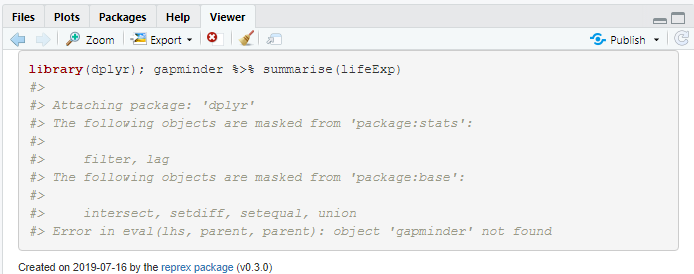
reprex({library(dplyr); gapminder %>% summarise(lifeExp)})
#>
#> Attaching package: 'dplyr'
#> The following objects are masked from 'package:stats':
#>
#>     filter, lag
#> The following objects are masked from 'package:base':
#>
#>     intersect, setdiff, setequal, union
#> Error in eval(lhs, parent, parent): object 'gapminder' not found
dplyr is ok now, and the pipe operator works, but we now realise that the gapminder package has not been loaded; let’s try again.
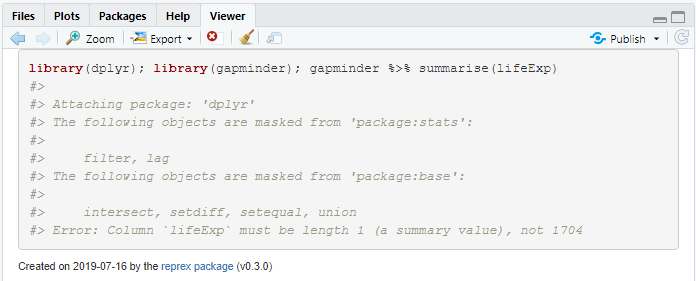
reprex({library(dplyr); library(gapminder); gapminder %>% summarise(lifeExp)}
#>
#> Attaching package: 'dplyr'
#> The following objects are masked from 'package:stats':
#>
#>     filter, lag
#> The following objects are masked from 'package:base':
#>
#>     intersect, setdiff, setequal, union
#> Error: Column `lifeExp` must be length 1 (a summary value), not 1704
The error we get relates to the use of the summarise function; this function summarises many values into a single summary, like mean, min, median, etc. R tells us that lifeExp must be of length 1 (a single summary value) rather than 1704 values which is how many values lifeExp has.
17.5 Further Resources
This page last updated on: 2020-07-14